The aim of profiling is to generate files that can be analyzed to see where compute time and resources are spent during the execution of a program. This can be useful to determine where the bottlenecks in your program exist and where things might be able to be improved.
Dependencies
sudo apt install valgrind kcachegrind
Compile with debugging information
# CMakeLists.txt
add_compile_options(-g)

OR

$ cmake -DCMAKE_BUILD_TYPE=RelWithDebInfo ..
$ make -j24
Run profiling and Interpreting the results
valgrind --tool=callgrind [your-program] [program options]
kcachegrind callgrind.out.XXX
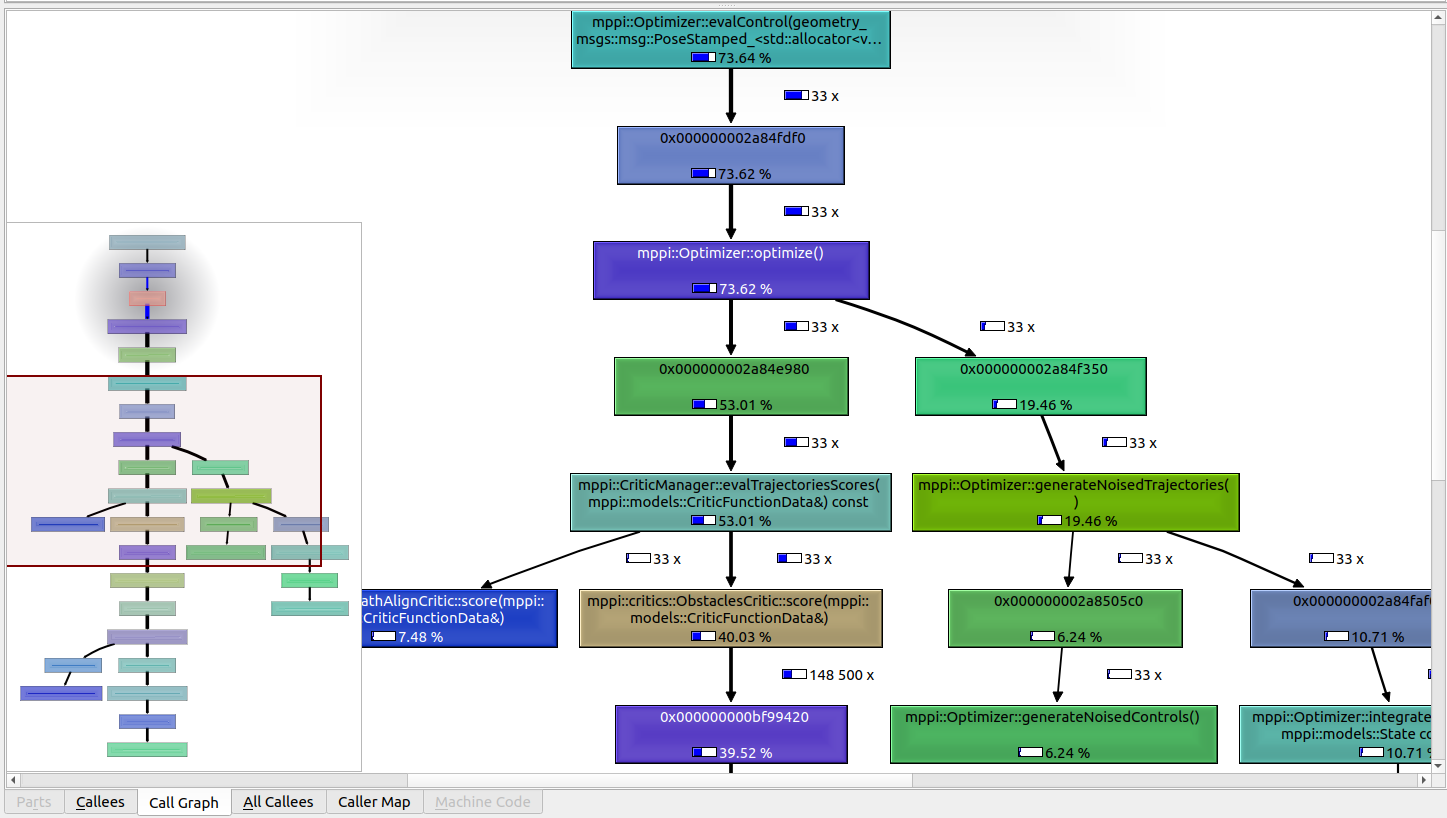
- If you select the top level entry on the left sidebar, then select “Call Graph” at the bottom of the right workspace, it should show you a call graph of where the compute time was spent as a graph of method calls. This can be exceptionally helpful to find the methods where the most time is spent.